


The last step is to visualise the existing observed, and the proposed predicted for comparison.
- First create thematic map for existing
- Step One : Choose Line Ranges default -> Next
- Step Two : table = “pedmov”, Field = “ex_allday_pedmov”
- Step Three Ranges : Ranges= 8, Method = Natural Break -> Recalc – > OK
- Step Four : Choose Top colour = Red, size= 3, Choose Bottom colour = Blue, Options -> Auto Spread Style by = HSV, Inflection = 2 – > ok
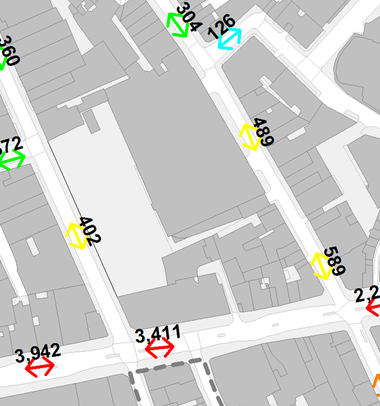
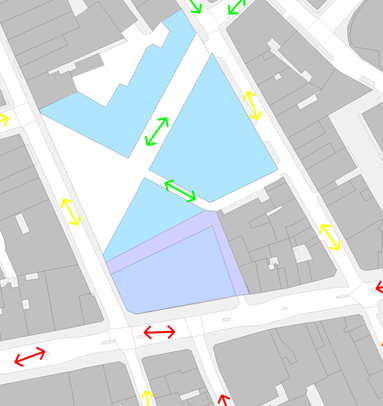
- Created pedestrian movement thematic from red to blue.
- Repeat the same steps for both existing observed and proposed predicted. A and B
- now you have completed the urban performance model tutorial
Press link for an animation of the steps.