How are spatial relations measured and analysed?
1. The central role of a justified graph
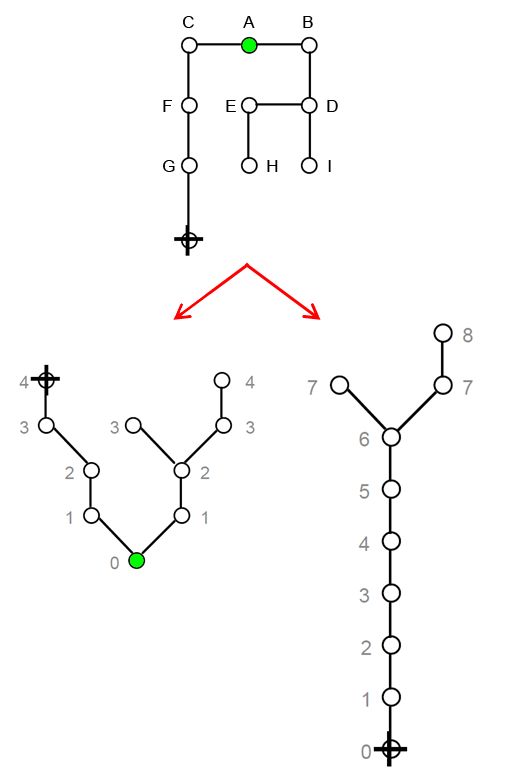
Complex spatial relations, represented as a graph, can be visually simplified by drawing a justified graph. A circle is put at the base representing the root of the graph, and then all circles directly connected to that root – meaning depth 1 – are aligned immediately above it and all circles at depth 2 are directly connected to those at depth 1, and so on until all levels of depth from that root are accounted for (see figure A )
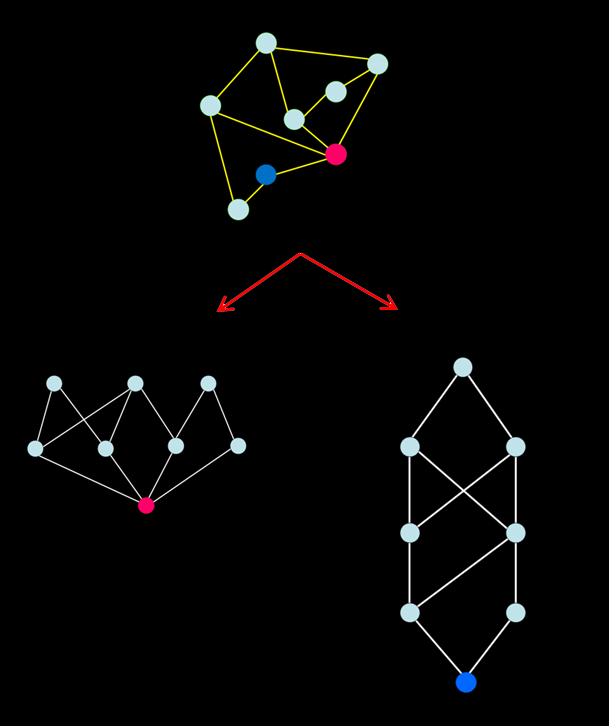
When justified graphs are drawn from different root spaces, the shape of the graph changes (see figure A). Each graph gives a picture of what the whole layout looks like from that particular space. The key is that a spatial layout of either a building or a settlement not only looks different but is different when seen from different perspectives. (see figure A and B)
2. Three concepts of distance
One of the basic ideas in measuring spatial relations is the concept of depth, meaning the distance between any pair of spatial elements. Three definitions of distance are used:
1. Topological distance, the number of turns from one space to another (see figure A)
2. Angular distance, the angular change from one space to another
3. Metric distance, the Euclidean distance in metres from one space to another
Different spatial patterns will be generated by assessing the three types of distance.
3. Syntactic measures
The three concepts of distance can be applied to calculate different syntactic measures:
a. Integration (or closeness)
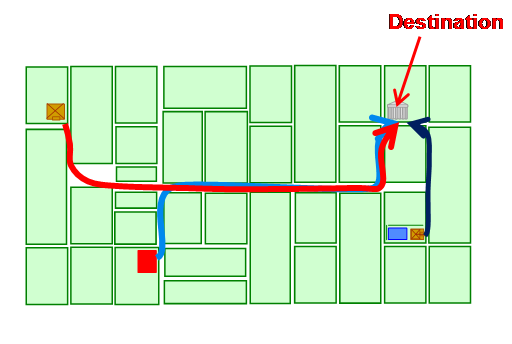
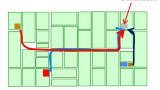
One of the fundamental syntactic measures is integration, or mathematical closeness. This is the calculation of how close or how accessible each spatial element is to all others under each definition of distance, such as the least angular distance. For example figure A illustrates how easy it is to go from three buildings to the same destination, following smooth and continuous routes.
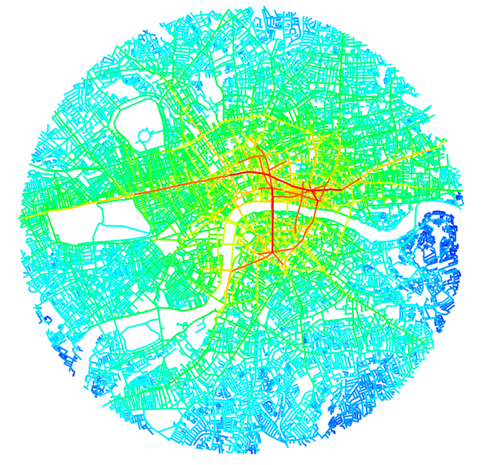
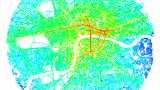
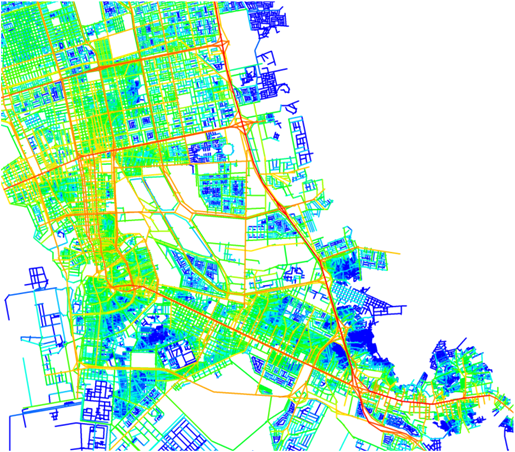
Integration can be used to assess how much potential the space has as a destination for movement, called the to-movement potential, by generating an integration pattern (see figure B).
For a mathematical definition of integration, see The Social Logic of Space (108-113); Hillier & Iida, 2005; Hillier et al, 2012. To learn how to produce integration patterns, see tutorials.
B. Choice (or betweenness)
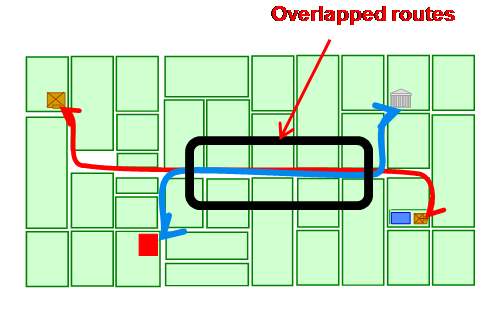
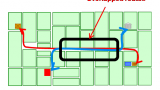
Another widely used syntactic measure ischoice, or mathematical betweenness. This measures the degree to which each spatial element lies on the shortest paths, under each definition of distance,between any pair of spatial elements (see figure C).
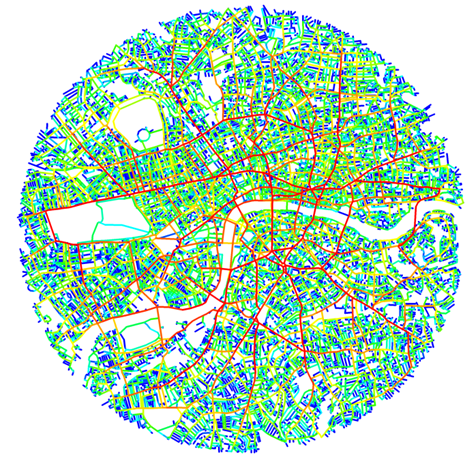
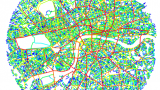
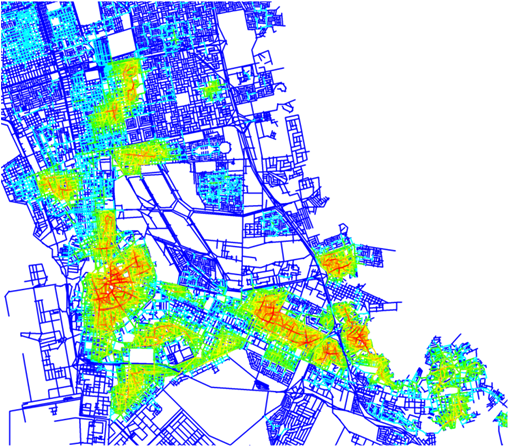
Choice assesses the potential of the movements passing through each space, called the through-movement potential, in contrast to the to-movement potential measured by integration. Through-movement patterns can be examined by producing a choice pattern. (see figure D)
For a mathematical definition of choice, see Hillier et al , 1987; Hillier & Iida, 2005; Hillier et al, 2012.
To learn how to produce choice patterns, see tutorials.
c. Scale – Radius
In order to analyse the spatial properties found at different scales (see figure A and B ), the concept of radius is introduced to serve as a tool for selecting sub-systems which can be analysed around a particular space (eg. by walk or by car). For example, we can select all spaces up to 400m, 800m, 2km or 5km from a particular space.
As a result, we have a package of measures to assess spatial configuration varying different types of distance and/or radius. These can potentially yield a large set of possible syntactic measures.
4. Other measures
Other syntactic measures comprise connectivity, total depth, entropy, intensity and so on. For fuller details, please see the glossary. The measures most commonly used in space syntax are angular choice and angular integration at various metric radii, because these measures have been supported and verified by a large number of studies and practical applications.
In particular, academic research (e.g. Hillier & Iida, 2005) has demonstrated that least angular analysis, rather than fewest turns and/or metric shortest routes analysis, best corresponds to the movement patterns observed in real cities. The most likely explanation for this result is that people use an angular geometric model of their environment to calculate distance.